Introduction
Vibration and Vibration Pro are iPhone/iPad applications which use the internal accelerometer, gyroscope or an external sensor to analyze vibratory and rotational motion. By placing the iDevice or external sensor firmly in contact with an object and pressing the sample button it is possible to record the motions of the object in each of up to three axes. The acceleration or rotation is displayed on the screen in the Time Series tab. In addition Vibration and Vibration Pro also perform a frequency analysis of the data and has the ability to display the amplitude of the motion vs. Frequency.
The Vibration family of apps are true vibration spectrum analyzers. They acquire and display time series data, optionally remove DC bias, apply various windows and perform an FFT on each channel producing frequency spectra. The internal 3-channel accelerometer has a sensitivity of approximately 0.001g and a range of +/-7.5g making the iPhone and iPod Touch sensitive enough to analyze the vibration of most moving machinery. The gyroscope is so sensitive that I have not been able to determine its lower limit.
For professional level vibration analysis Vibration and Vibration Pro can use the following external accelerometers. These are included with Vibration Pro. Access to them can be enabled with an In-App purchase in Vibration.
- 333D01 Digiducer Accelerometer
- 333D04 Digiducer Accelerometer with large 100g range
- 633A01 USB Accelerometer
- 485B39 Digital ICP two channel USB sampling input
- CTC WS200 Bluetooth wireless Accelerometer
The first three devices interface with the lightning or USB C ports built into the iPhone and iPad. You will need an interface cable and we have found that Apple branded cables are the most reliable. We recommend the following:
Vibration and Vibration Pro also sample the internal microphone so that you can perform frequency analysis of audio signals.

As of version 4.18 there is an option to use the Sabrent USB-C input dongle in both Vibration and Vibration Pro. This dongle has an input and channel and an output channel. The dongle is normally used for a microphone input and a headset output but it can also be used as a single channel -0.1V to 0.1V high impedance electrical signal input.
In many applications The Vibration apps can be excellent portable alternatives to expenseive commercial spectrum analyzers. In predictive maintenance applications the apps can help identify bearing defects, shaft misalignment, imbalance, and structural resonant frequencies. They are also useful for monitoring the acceleration of part and material handling equipment.
Vibration Pro
For professional applications diagnosing machinery such as HVAC systems and factory machine tools Vibration Pro includes the ability to script a complete suite of measurements to guide the technician through the data collection. The results are all compiled into a single folder which can be emailed to the service engineer for analysis. Scripts are easily created using an included Excel spreadsheet. The scripts are simple .csv files which can be stored on the device or emailed to a remote location where they are easily loaded into Vibration Pro. The ability to execute scripts is easily accessed through a monthly or annual subscription which conveniently auto renews.
The software is flexible and easy to use. It was written to emulate the familiar oscilloscope based spectrum analyzer. Sample rate and sample delay are easily adjustable and the user can select the length of the data acquisition. The vertical scale used for the display can either be set manually or the app will auto-scale the results for optimal display detail. Once the settings are configured simply press the sample button. When a test is complete the resulting data can be emailed, saved to the device or a cloud file sharing service.
Technical Goodies
The iFamily of devices include a MEMs accelerometer and a MEMs gyroscope. Apple provides a software interface to these devices allowing programmers to access the data at sample rates up to 100Hz. A 100Hz sample rate allows measurement of motion up to frequencies of 50Hz which is equivalent to 3,000 rpm (for those who want to know why frequencies are limited to 50 Hz Google "Nyquist Sampling Theorem").
We realize that many users want higher sample rates in order to measure higher frequencies. Apple has limited the sample rate of the internal accelerometer and gyroscope to 100Hz and it is not possible for an app programmer to bypass this limit. Higher sampling frequencies require external hardware such as the Digiducer Accelerometer or one of the other devices listed above.
What's New
Highlights of recent releases. For the complete list of changes in each version, see Version History.
Version 5.01
- A new, more robust Bluetooth connection handler that reconnects more reliably and provides clearer device status when using multiple Bluetooth sensors across different locations (Vibration Pro only)
- Improved timebase calibration of the CTC WS series of sensors. Measurements now use the sample rate each sensor reports for itself, so reported frequencies may differ from earlier releases — typically by 2% to 4%. The new values are the correct ones (Vibration Pro only)
Version 5.00
Version 5.00 is a major redesign of Vibration and Vibration Pro, with an all-new modern interface and a number of new features. Features marked (Vibration Pro only) are available only in Vibration Pro; features marked (Vibration only) are available only in Vibration. Highlights include:
- A completely redesigned interface with consistent, color-coded X, Y, and Z channels and card-based layouts
- Redesigned Time Series view — each channel in its own card, with a sensor and data-file info bar and a stats bar showing vertical scale, horizontal scale, duration, and sample rate
- Redesigned Frequency Analysis view — floating Integrate, Differentiate, and Peaks buttons, plus a color-coded peaks list
- A tap-and-drag cursor readout on both plots to read exact values at any point, in portrait or landscape
- Improved landscape mode with full-screen plots and an auto-hiding toolbar (swipe down from the top edge to reveal it)
- Redesigned settings screens for Data Source, Acquisition, Triggering, Time Display, Frequency Display, and Options
- A new PDF report that is crisp and identical on iPhone and iPad, including both plots, the sensor name, and the data file name
- Guided accelerometer calibration with an on-screen orientation guide, a live stability meter, a reposition countdown, and audible cues (Vibration only)
- A redesigned Machine Menu (Vibration Pro only)
- A redesigned Scripting screen with a command list and Run and Load buttons (Vibration Pro only)
- New
Save_ReportandSave_Report_Asscript commands (Vibration Pro only) - A refreshed tab bar and icons, a new splash screen, a redesigned Help screen, and numerous bug fixes and stability improvements
What's the difference between Vibration and Vibration Pro?
Both Vibration and Vibration Pro include all of the same data analysis options. Vibration Pro adds the ability to use the CTC WS200 and WS300 Bluetooth wireless Accelerometers. Vibration Pro also includes the ability to acquire data from a variety of external sensors with the base purchase price while these require an in-app purchase in Vibration. This keeps the cost of Vibration low for hobbyists who typically do not need and cannot afford professional quality external sensors.
Vibration Pro also includes the ability to script the application to help automate data collection. The ability to run scripts is activated through an in-app purchase as a monthly or annual subscription.
Please note that both Vibration and Vibration Pro use the same data file format so data taken with Vibration Pro can be analyzed with the more economical Vibration and visa versa.
Getting Started
- Touch the Acquire button on the Time Series screen. The screen will clear and begin taking data. Shake the device gently and you will see the acceleration on the screen.
- Touch the Acquire button a second time. This time when the data acquisition starts shake the device gently at a constant rate for the entire duration of the acquisitions.
- Touch the frequency icon. You should see a peak near 0 and at least one more peak at the rate at which you are shook the device.
- If there is an object you want to measure touch the Settings tab and then touch the Data Acquisitions Settings selection. Move the Sample Delay slider to approximately 5 seconds
- Return to the Time Series Tab. Touch the Acquire button. You now have 5 seconds to position the device
- Place the device on the object you want to measure. When the timer counts down to 0 the sampling will begin automatically
You have now taken vibration data!
Detailed Help
Time View

The time series view shows the time traces for all of the active channels. In the case of both the internal accelerometer and the internal gyroscope three channels are available. They are described in more detail in the settings section which discusses the available Data Sources.
Each channel is plotted separately and the maximum, minimum and rms value for each channel is computed and displayed. In addition the data from all channels is added in vector form and the rms magnitude of the combined data is printed near the bottom of the screen.
If you touch the screen you will be presented with a vertical cursor which you can slide along the data to obtain precise readouts of the value of the data under the cursor. In the Frequency View the cursor will snap to the 5 highest peaks on each channel making it easy to read out the amplitude of the frequency peaks.
There are two ways to zoom into the data to get a closer look. If you double tap the screen at an area of interest the plot will zoom in by 3x so that you can get a closer look at the data. Alternatively you can use the familiar pinch out to zoom. The maximum zoom is about 6x. To unzoom simply double tap a second time or pinch in. If you pinch in a zoomed view it immediately reverts to 1x zoom.
 Acquire Button
To start data acquisition press the Acquire button. This will start the data acquisition process. Once this button has been pressed it will change to a Cancel button and allow the acquisition to be terminated by touching the button a second time.

 Save Data and Load Data Buttons
If you would like to save a data set, press the Save Data button. A dialog box will open with a default file name set to the current date and time. You can edit this file name as you see fit. When you press OK the Files Dialog will open and you can select where the file will be saved. By default the data will be saved to the Vibration Pro documents folder. You can recall this data using the Load Data button.
To access the data you can open the Files app on your iPhone or iPad. This will allow you to browse for your files and if you like, to copy them to cloud storage or to a memory stick. If you are looking for files that you recorded using the Auto Save option in the app they can be found in On My iPad/iPhone -> Vibration Pro. The Files app also allows you to delete files which are no longer needed. Apple provides a very good tutorial on the Files app here Apple Files Tutorial.
Data files are stored as .csv files so they will open directly in Excel or Numbers.
The data files consist of a header which contains information about the acquisition including which sensor was sampled, the number of channels, the number of data points/channel, the sample rate and the position and speed of the device at the time of acquisition and the state of the frequency data when the data was saved (acceleration, velocity or displacement). Following the header are three data sections. The first data section contains the time series data and the second data section contains the frequency series data and the final section contains a list of the 5 highest peaks and the amplitude for each active channel.
 Machine Menu (Vibration Pro Only)
The Machine Menu icon opens a window which will allow the user to load and display a graphical interface for selecting a script for testing a specific machine. This menu is configured by a user for their specific needs using a simple .csv file and will display a list of machines and optional images. When the user selects one of the machines in the list Vibration Pro will automatically load the script which is specific to that machine.
The typical use case for this option is for field service testing. The menu and scripts would be created by a test engineer. The engineer would then provide a folder with the menu definition file, images and scripts to the field technician. When in the field at a customer location the technician would launch Vibration Pro and load the machine menu. They would then select the machine to be tested, run the script and then send the collected data to the engineer for evaluation.
For instructions on how to create the machine menu, copy the Excel file VibrationPro Script Builder.xlsm file to your computer. The file can be found using the Files app on your iPhone/iPad in Files->On My iPad/iPhone -> VibrationPro. It will be necessary to have Excel loaded on your computer and to enable macros when opening the file. Once the file is opened navigate to the "Machine Menu Instructions" tab. Follow the instructions on this tab to create the Machine Menu.
 Saving and Loading Settings (Vibration Pro Only)
Often it is desirable to capture and save the current Vibration Pro configuration for a specific test in order to be able to reproduce the test with the same configuration again in the future. By touching this button a dialog will appear which with the options of both saving and loading application settings.
 Run Script Button (Vibration Pro only)
To run a script touch the script button, this will take you to the Run Script view. At the top of the page are two buttons. One button is the Load Script button. Touch this button and navigate to find the script you want to run which you either created or was sent to you by the engineer. Touch the script and it will load. The script listing will be shown in the lower section of the screen.
Next to the Load Script button is the Run Script button. This button will be greyed out with a Subscribe button below if you have not subscribed. If you have subscribed to the ability to run scripts, press the Run Script button and the script will execute.
 Report Button
The report button gives you the option of either generating an email containing Time Series and Frequency view screen captures, a full data report, a CSV file of the data and for sample rates above 70Hz the email will also contain .wav files of the data for each channel allowing you to play the data through your sound system.
The .CSV file also contains a list of the 5 highest peaks for each channel. This information can be found at the bottom of the file.
Rather than typing an email address each time you want to email data you can also set a default address in the Options page of settings. This email address will then automatically be added to each email document.
Frequency View

The frequency view displays the frequency content of each channel. For those who are interested it does this by performing a Fast Fourier Transform the data from each channel and scaling the results appropriately.
The frequency data can be displayed in a variety of ways such as linear-linear and log-log plots. A touch cursor is also available to enable precise readout of the values of specific data on the graph. The cursor will "snap" to the 5 highest peaks on each channel to make inspection easier.
The Vibration apps also have the ability to display harmonic cursors to the right of the main touch cursor to aid with data evaluation. Vibration can display a single harmonic cursor at 2x the cursor frequency and Vibration Pro will display the 2nd, 3rd, 4th and 5th harmonics.
When using the accelerometer the frequency results are in units of 'g' which is one gravity of acceleration. Equipment vibration analysts often want to see units of velocity in either mm/s or in/sec. It is simple to convert the frequency data to velocity data, just touch the integral sign  on the right side of the screen. If you touch the integral sign a second time the data will be converted to displacement (mm or inches depending on the units setting). You can also convert back to acceleration by touching the d/dt or differentiate button
  which appears when you first touch the integral button.
Note on integration and differentiation
Pressing the integrate and differentiate button only changes the frequency plot. The Time Series plots remain in the same units and cannot be integrated and differentiated. If you convert the data using integration or differentiation and then save the data the modified frequency data is saved in the .csv data file and can be used for additional analysis with external software.
You can view the 5 highest peaks for each channel by touching the Peaks button  on the right side of the screen. This will pop up a window with a listing of the peaks. When you are done viewing the peaks touch the peaks button a second time or on the iPhone just touch the "X" in the upper left corner of the window.
As with the time series view, there are two ways to zoom into the data to get a closer look. If you double tap the screen at an area of interest the plot will zoom in by 3x so that you can get a closer look at the data. Alternatively you can use the familiar pinch out to zoom. The maximum zoom is about 6x. To unzoom simply double tap a second time or pinch in. If you pinch in a zoomed view it immediately reverts to 1x zoom.
Other options for the frequency display can be set in the Frequency Display Settings view.
Settings
The settings tab provides access to a variety of pages to set up the options for the data acquisition and display.
Data Source
To select the input data source touch the Data Source item in the Settings menu. The screen which is displayed will let you select among the available input options. The standard input options in the standard version of Vibration are the Internal Accelerometer, the Internal Gyroscope, the Internal Microphone and the headset microphone (if connected). When you touch the desired data source a checkmark will appear next to the selection.
There is also the option to use the Digiducer Accelerometer, the 633A01 USB Accelerometer, or the 485B39 Digital ICP two channel USB sampling input as input devices. These inputs and their full functionality are standard in Vibration Pro. If you are using Vibration you have the option of using these sensors but with limited functionality. Vibration allows you to try before you buy. The trial version is limited to a single sample rate but all other options are fully functional. If you have not purchased the ability to use the Digiducer sensors, when you select the sensor you will be presented with an option to purchase By touching the Purchase button you will be taken to a screen where you can purchase the ability to use these devices with full functionality.
When you connect the Digiducer or Digital ICP, the calibration data embedded in the device by the manufacturer will be transferred to your device automatically. When using the 485B39 device the scale factor for both channels defaults to 0.1 V/g (typical accelerometer calibration values) but you can edit these values with the actual device calibration values supplied by the manufacturer.
When using bluetooth sensors such as the WS200 the app needs to find the sensor by listening for periodic broadcasts. Sensors which have been connected previously will show up first, new sensors will take a little longer to locate. On the Data Source settings page you will see a line stating Scanning for BT Sensors… during the search process. This line will change to Scan for Bluetooth Sensors the search is completed. If you have selected a bluetooth sensor as the last sensor you used, when you restart the app you will see that the Acquire button on the Time Series page is greyed out. It will activate when the previously selected bluetooth sensor has been found. If it does not activate then the sensor you selected may not be in range.
When working with bluetooth sensors the reliable connection range is about 10 meters. You may be able to connect to the sensor at greater distances but the connection may not be reliable. You may find that measurements work intermittently. If that happens try moving your iPhone or iPad closer to the sensor.
NOTE for Vibration users
If you have purchased the Digiducer/Digital ICP option and you needed to restore your device, or you have deleted Vibration and reinstalled or you have purchased a new device this page will also allow you to restore a previous purchase. When the dialog box appears with the option to Purchase select this button. Once the In App Purchase screen appears simply press the Restore Purchase button while logged into the app store using the account you used for the original purchase. The app will verify your purchase and enable the Digiducer (333D01, 333D04 or 633A01) or the Digital ICP (485B39) input at no additional charge.
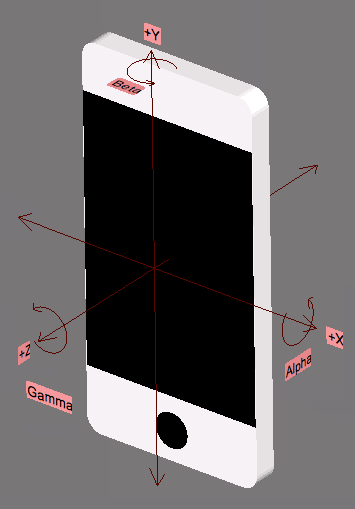
The coordinate systems for the internal accelerometer and gyroscope are shown in the following image.
When using the microphone the Data Acquisition Settings screen has a setting for calibration of the microphone in units of mV/Pa. The scaling assumes that the microphone input is +/- 1V full scale input. I believe that the default calibration value of 16 mV/Pa is reasonably close for the internal microphone but for accurate amplitude measurements this numbers should be calibrated using a standard calibration microphone.
Data Acquisition Settings
Setting up the data acquisition settings is the single most important step for successful use of the application. The parameters presented in this screen may vary depending on the input source but will be similar to the items described below.
Max Frequency Fmax (Hz)
Sets the sample rate of the device to allow measurements of frequencies up to Fmax. The units are in Hz. The sample rate will be approximately 2x Fmax and this is set by the Nyquist Theorem.
When using the microphone or an external sensor as the source a SLOW|FAST option will be presented. The FAST option will present the default sample rates. The SLOW option will present sample rates which are slower by a factor of 5. When switching between SLOW and FAST the sample length durations are adjusted accordingly.
Sample Delay
The Sample Delay is the number of seconds after pressing the Acquire button before data acquisition begins. This allows the user time to position the device or start an experiment. This may be used in conjunction with Triggering in which case the sample delay will occur first and then the system will begin waiting for the trigger.
Sample Length
The Sample Length control allows the user to set the duration of sampling. The longer sample lengths are useful for measuring events which take longer periods of time to complete. The longest sample times can take some time to process and plot making the app take longer to switch between the various displays.
Auto Save
Enabling this option will result in the data being automatically saved to the device at the completion of data acquisition. The file will be named VibrationData YYYY-MM-DD at HH MM.csv. These data files can be reviewed at a later time using the Load button or by copying to a cloud service from the Files app.
This option is also very useful when used in conjunction with Auto Repeat.
Vector Sum
The Vector Sum switch is displayed when using the internal sensors (the three axis accelerometer and the Gyroscope). When this switch is turned on the three channels from the selected input are added together by taking the root sum squared of the three channels to create a new, single channel signal. This is useful for displaying the magnitude of the motion independent of the direction.
Auto Repeat
When Auto Repeat is turned on Vibration Pro will automatically repeat data acquisitions and display continuously until the Cancel button is pressed. If Auto Save is enabled each acquired set of data will automatically be saved for later review.
When using Auto Repeat you can switch to the Frequency tab and the frequency data will display as soon as the data acquisition is complete. You can touch the screen and use the cursor to examine the data until the next acquisition begins. When the system is acquiring data the graph will remain on the screen but because the data is in flux the cursor position and values will be zero.
When you switch to the frequency view Vibration and Vibration Pro will check the auto-repeat delay and if it is set to 0 it will increase the delay to 1 second to allow time for plotting the frequency data.
The program will allow you to change settings when auto-repeat is enabled and most of the time this works as expected.
When you are ready to stop taking data touch the Cancel button which replaced the Acquire button at the start of acquistion. The app will ask if you want to finish taking the current data set or halt immediately.
Auto Repeat Delay
When using Auto Repeat the normal mode of operation is to begin the next acquisition as soon as the previous acquisition data has been saved. If a delay is desired between Auto Repeat acquisitions the Auto Repeat Delay slider can be used to adjust the delay from 0 to 600 seconds.
Viewing the Auto Repeat Delay controller may require scrolling on smaller screens.
Calibration Settings
For some input devices this screen also contains calibration settings. If you plan to edit these values it is recommended that you write down the orginal numbers so that you can restore them in the event the new numbers do not work properly.
Triggering
As with a stand alone vibration analyzer or spectrum analyzer it is sometimes useful to trigger on an event. Vibration and Vibration Pro allow setting triggers for any of the three internal accelerometer channels or the microphone input. (Sorry, no triggering on the gyroscope yet). To set a trigger simply turn on the desired channel and adjust the slider to the desired trigger value.
When using external devices such as the Digiducer 333D01, 333D04, 633A01 or the two channel 485B39 ICP the Microphone Trigger switches to this device. When using the 485B39 the trigger is on Channel 1. Please be aware that there will be some latency between the trigger event and the first data point due to the way the iPhone audio input sampling works. The resulting triggering will not be as precise as you might be used to on an oscilloscope.
Time Display Settings
The Time Display Settings are used to set how the time series data is displayed. The vertical scale sets the scale per division on the time series display. There are also three multipliers which allow for larger ranges. When using the accelerometer input the multiplier will typically be set to 1x and the scaling can be set appropriately using one of the selections in the top row. The gyroscope has a much larger dynamic range and if the device is rotating rapidly it may be necessary to increase the scale by 10x or 100x in order to keep the values on screen. Note that you can change these values without needing to re-acquire the data.
When the Autoscale switch is on the data will automatically scale to fill the display when the data acquisition is complete. For the internal sensors which are displayed live the current vertical scale settings are used for the live display and then once the acquisition is complete the data will automatically rescale.
The Subtract Mean switch is used to remove a constant bias from the data. This is particularly useful when using the accelerometer to measure vibration because gravity will typically add 1g to the channel which is aligned with the vertical axis.
The Plot All Points switch introduced in version 3.91 toggles between plotting every time series data point and plotting a maximum of 1024 data points. Because of the speed of earlier iPhones and iPads plotting every point could make the display of the time series quite sluggish so the maximum number of points plotted was limited to 1024 per channel. As processors increased in speed this became less of an issue and some users wanted to see every data point. This switch was added to allow the user to select whether to plot every point or a maximum of 1024 points. When turned on, depending on your device, there could be a noticeable delay when refreshing the time series plot after switching screens or changing the orientation of the device.
The Show Channel switches allow you to turn off channels which do not have data which is of interest. This give the remaining channel(s) more room on the screen and therefore more detail can be observed.
Frequency Display Settings
The Frequency Display Settings are used to set how the frequency display is formatted.
The Show Channel switches allow you to turn off channels which do not have data which is of interest. This give the remaining channel(s) more room on the screen and therefore more detail can be observed.
Plot style - Linear and Log
The user has the option of displaying the frequency data in linear-linear format in which case the three channels (if available) are plotted in separate sections of the screen as in the time display window. More advanced users often want to use log scales for one or both of the frequency axes. When log scales are selected the three channels are plotted on top of each other. In most cases it is easy to see the three plots but in the event they overlay and the user desires to see the details of one or two plots more clearly individual channels can be turned off and on. This option is also available in linear-linear mode. Turning off one or more channels will increase the size of the remaining channel plots providing better vertical resolution.
Harmonic Cursor
When analyzing frequency data very often there is both a fundamental frequency and one or more harmonics. The most prevalent harmonic is at 2x the fundamental frequency but additional harmonics can also be present at higher multipliers of the fundamental frequency. When Harmonic Cursor is enabled second, third, fourth and fifth harmonics indicated with light gray cursors are displayed when the user touches the screen. The user's finger is used to position the fundamental cursor and the app will automatically display the harmonic cursors. Note that Vibration only displays the second harmonic cursor.
Zoom Options (2D Zoom/Horizontal Zoom Only)
The pinch to zoom option up until version 3.97 has always zoomed in both X and Y equally. Some users have requested the ability to only zoom the frequency data horizontally so they could spread out the X axis and see closely spaced peaks better. Version 3.97 adds an option to select between 2D Zoom which was the default previously and Horizontal Zoom Only . When using Horizontal Zoom Only any pinch out gesture whether a horizontal or vertical pinch out will zoom in the frequency axis only and the vertical scale will not change.
HINT: It can be tricky to zoom out near either end of the screen. The tendency is to spread your fingers horizontally but that does not work well or let you expand data right at the edge. If you want to expand the data at either edge in the Horizontal Zoom Only mode place your fingers together right at the edge of the screen and spread them vertically. While this may be counterintuitive it works to zoom the data right at the edge of the screen in a horizontal direction.
Peak Hold
Peak hold is a useful feature to help pull frequency peaks out of noise. At each freqeuncy it retains the highest value which occurs during a number of data acquisitions. This feature can be used in two ways. The most common method is to turn on Peak Hold and then go to Data Acquisition Settings and turn on Auto Repeat. Then put the device where you want to take data and press Acquire. Now switch back to the Frequency view. After each acquisition the frequency data will update.
Alternatively it is possible to take data manually with Peak Hold turned on. Each acquisition will update the frequency data.
At any time during peak data acquisition you can clear the accumulated data and start again by touching the Clear Data button. This is the eraser button which appears on the right side of the Frequency view whenever Peak Hold or Running Average is turned on.
Running Average
Running average is another feature to help pull frequency peaks out of noise. Where Peak Hold will allow you to see short duration occurances of a frequency, Running Average helps you better extract a frequency which is extremely low amplitude. Normally Running Average is used in conjunction with Auto Repeat found on the Data Acquisition settings page. It is recommened that you turn on both Running Average and Auto Repeat, place your device in the location where you want to measure, press Acquire and then touch the Frequency tab. You can now watch the frequency data evolve as each data set is aquired, processed and averaged with the previous data.
As with Peak Hold, you can clear the accumulated data and prepare for a new acquisition by touching the same Clear Data (eraser) button on the right side of the Frequency view.
Peak Search Limit
The Peak Search Limit field allows the user to control the low frequency start limit for the peak search function. The algorithm which searches for frequency peaks will start at this frequency and search for peaks between this value and Fmax. Very often there is a large peak at 0 Hz as well as at very low frequencies which may not be important when looking for higher frequency vibrations due to bearing failure or rotational imbalance. By setting the Peak Search Limit above these low frequency disturbances they can be ignored in the peak finding analysis.
The Peak Search Limit default is 5 Hz and it can be set from 0 Hz to 1/2 Fmax. Attempts to set higher than Fmax will be automatically corrected.
Alarm Limit - Vibration Pro Only
Sets a limit value for the frequency data. Where the frequency data exceeds this value the plot lines will turn a bright yellow showing the user at a glance that the data exceeds the limit. To clear the limit function set this value to 0 or clear the field.
Frequency Units
When rotating machinery is being measured users typically want the horizontal axis to be displayed in units of revolutions per minute (RPM) rather than cycles per second. The Frequency Units control allow the user to select the frequency units.
Window
The Window control allows the user to apply Hamming, Hanning or Flattop windows to the time series data prior to the computation of the FFT which converts time data to frequency data. If you understand the last sentence then you will know when you want windowing on and when you want it off. If you do not understand the purpose of windowing it is recommended that you leave the Hamming window selected.
Peak Finding
There is also an option to view a listing of the 5 highest peaks. The frequency display has a "Show Peaks" button on the right side which looks like two mountain peaks . If you touch this button a window is displayed listing the 5 highest peaks for each active channel. The peaks window can be dismissed by touching the Peaks button a second time.
Other Options
Other Options should be pretty self explanatory but just in case they are not…
Customer Name
The name entered in this field appears in the header of the PDF report, allowing the report to be branded with your customer's name. Leave the field blank if you do not want a name in the report header. This value can also be set from a script using the Enter_Customer_Name command (Vibration Pro only).
Default email Address
The email address entered in this field will be automatically entered as the first address when you press the Email Data button in the Time Series view. This makes it quick and easy if you always send your test data to the same address.
Save Filename Prefix
The app creates default filenames for saved data and for emailed data. The default filename is "VibrationData YYYY-MM-DD at HH MM SS". The user now has the option of changing the file nameroot from "Vibration Pro Data" to any prefix such as "Chiller 1" or "Drive Motor". This new filename root will remain the default until changed by the user.
Coordinate System
Allows the user to select to see data in a left handed or right handed coordinate system. Mathematically this switch changes the sign of the Channel 3 axis for three axis sensors.
Timer Sounds
Turns on sounds for the countdown timer and also turns on sounds at the beginning and end of data acquisition. These sounds can also be turned off on an iPhone by putting the device in Silent mode.
Units
Adjusts the units used for display of the accelerometer and gyroscope data. Note that Acceleration will always be in units of "g's" or gravities. The units are important when the data is integrated and displaying in units of velocity or displacement.
Calibrating Accelerometer (Vibration only)
On most iPhone and iPad devices calibration is usually not necessary, most devices are very well calibrated from the factory. If you suspect that the internal accelerometer calibration is not correct or you are worried that perhaps you have a bad channel you can calibrate the device. If all channels are working properly the offset values will be very close to Zero and the Scale values will be close to 1.000. Offset values which vary from zero by more than 0.1 or Scale values which vary from 1.000 by 0.1 are rare and may indicate a problem. Note that you can enter calibration values manually on the Calibration Values screen or you can execute the calibration sequence by touching the Calibrate button.
When you touch the Calibrate button the device will guide you through the calibration process. Please make sure that when you hold the device in each orientation that you keep it square to the horizontal and you keep it very steady. If the software senses vibration or if the calibration values are very different from what is expected calibration will abort and you will see an error message.
Using the Sabrent Dongle
The Sabrent Dongle is normally used to interface analog microphones and headsets which utilize 3.5 mm mini plugs. Vibration and Vibration Pro use this dongle to provide a method to sample analog voltage inputs. Since the Sabrent dongle is made for a high impedance microphone it is designed for microphone level input signals. Your input signal must lie between -0.1V and 0.1V.
It will be necessary for the user to wire up a 3.5 mm mini plug as shown in the following image. The Signal+ wire needs to go to the middle band on the connector and the Signal- wire is connected to the tip. To avoid burning out the dongle (and possibly damaging your iDevice) you must make sure that the Peak to Peak voltage level does not exceed 0.2 V. If the amplitude of your signal is greater than 0.2V you must design an attenuator to reduce the amplitude.

The Sabrent dongle is available on Amazon
Scripts (Vibration Pro only)
The ability to run pre-built scripts is a powerful capability added to Vibration Pro. This capability was added at the request of professional users of the app to aid the diagnosis of complex rotating machinery such as HVAC systems. The users wanted to be able to prepare a testing protocol and send it to a technician for diagnostic evaluation of machinery at a remote location. The ability to use a script to guide a user through a complex series of tests can eliminate the need for the engineer to travel to the site of the problem saving thousands of dollars and days of travel. Once the script has been run the data can then be packaged and sent for analysis.
The scripting language is very powerful. It can adjust virtually all of the parameters available in the app and acquire multiple sets of data. During the process the script can give instructions to the technician on where to place each sensor and how to configure the equipement to be tested. All of the data can be saved on the device into a custom defined folder which can later be compressed and emailed to the engineer.
The capability to run scripts is available as an in-app subscription purchase which automatically renews on a monthly or annual basis. You can subscribe and cancel at any time and as many times as you like. If you cancel in the middle of a subscription period you will retain the ability to run scripts until your subscription expires.
Building scripts (Vibration Pro only)
The app is shipped with an Excel spreadsheet used to build the scripts. The Excel file is named "VibrationPro Script Builder.xlsm" and can be found in Files->On My iPad/iPhone -> VibrationPro. It is recommended that you copy this file to your PC or Mac for the creation of scripts because the iOS version of Excel does not support all of the features required for script generation. Also, any time the app is launched the version in this location will be update from the version stored in the app file. When the app updates it is recommended that you copy the latest version of the script creator Excel file to your computer and use it for the creation of future scripts.
VibrationPro Script Builder is an Excel Workbook designed to create scripts to automate the Vibraiton Pro iPhone and iPad applications. Using simple pop up menus you can add script commands and aguments to create a measurement flow to guide the acquisition and saving of Vibration Pro anaysis data.
Each script must start with a first line in which the command column contains "Vibration PRO iOSApp script". This line is used by Vibration Pro to validate that the file is a valid Vibration Pro script file.
Each line following the first line contains a script instruction. Each instruction contains two parts contained in Columns A and B. The first part in Column A contains a Command which must be selected from the drop down list. The second part contained in Column B is the argument for the command. For many commands the argument is also selected from a drop down list. If the drop down list is blank the argument is either not required or is a free field text entry such as the name of a directory for storing the data.
The available commands consist of setup instructions to configure the app, instructions for the user and commands to execute and save data. There is no limit to the length of a script.
If you want to temporarily comment out a command place an ! as the first character in front of the command.
The last command in any script must be the "End" command.
Helpful Hints
The first thing you should do is make a copy of this file in a new location. This file will be overwritten every time you launch Vibration Pro. It is recommended that you copy the file to a location where you can use a PC or Mac version of Excel. The iPad/iPhone version does not support Macros so the Save Script button will not work.
To aid in organizing your scripts there is a scripts folder created in the Vibration Pro folder on your i-Device (For example On My iPad->Vibration Pro->Scripts). This is for your and your user's convenience but you can store and load scripts in other locations on your i-Device or in accessible cloud locations such as iCloud, OneDrive or DropBox. If you are creating the scripts using Excel on your PC or Mac it is recommended that you first store them in a cloud folder in OneDrive, iCloud or DropBox. If you log your iDevice into the cloud account you can easily locate the file and run it from the cloud location or move the script files to the Scripts folder. If you email a script to a user they will need to save the script file to a location on the i-Device using the Files app.
The script commands duplicate all of the setup features available in the Vibration Pro app settings. Since you do not necessarily know how the app was setup prior to running the script it is strongly recommended that the first part of your script be used to configure all settings.
The script commands allow you to create directories to save your data. It is recommended that when starting a measurement sequence you create a directory and then all of your save commands will save data to this directory. When measurements are done this directory can be found on your iOS device using the Files app. The directory will be found in "On My iPhone/Vibration Pro/<Directory Name>" or "On My iPad/Vibration Pro/<Directory Name>". To email this data the user can touch and hold the directory until the pop-up menu appears and select compress. A .zip file will be created. Touch and hold this file and select "Share". Select Mail and an email will be created with the zip archive attached.
To aid in organizing the date on your i-device there the command Set_Master_Directory_To_CY_ON. If you put this command at the start of your script then any directories you create in your script will be placed in a master directory named as the current year.
There is a very useful command used to give the user instructions on how to setup a measurement. The command is "Instruction" and the argument is a text statement which are instructions to the user. When the script encounters this command the text argument will be displayed on the screen and will wait for the user to press OK before continuing.
There is also a command entitled "Comment". You can enter any text you like for the argument to help document your script. During execution this command is ignored.
As you work on creating your script it is recommended that you save the Excel file with a descriptive name. When the script is complete and ready for testing or deployment press the "Save Script" button to the right of the script at the top of the page. This will execute a macro which saves the script in the proper format on PC's but requires Mac users to select .csv in the file type drop down menu below the file listing.
The Instructions tab in the Excel file has a commented example script that you can study.
Script Commands in Alphabetical Order (Vibration Pro only)
New commands included in this release are in red
Add_Comment_To_Text_File
It is often desirable to include a text file with the data with details about how the data was taken. This command adds text to a text file buffer which can then be saved using the Save_Text_File_As command. You can add as many lines of text to the text file as you like.
Add_Version_To_Text_File
Use to add the current Vibration Pro version information to the text file. This is very useful for debugging problems because it tells the engineer which version of the app was used to take the data.
Clear_Frequency_Data
Used to clear the frequency data buffer when preparing to use Peak Hold or Running Average
Comment
Adds a comment to the script file. The script execution ignores this line. Comments are primarily used for commenting your script code.
Clear_Frequency_Alarm_Limit
Clears the Frequency Alarm Limit by setting the value to 0.0.
Clear_Text_File
Once you have added lines to a text buffer and you have saved this buffer you use this command to clear the text file buffer so that you can start a new text file.
Create_Directory
Creates a Directory or folder on your iDevice. All future data and text files will be saved in this directory. for
Immediately after creating the directory VibrationPro places a copy of the current script into the directory. This is feature was added in version 4.06 to allow the engineer to know which script was used for data acquisition.
Create_Directory_From_Jobsite_Machine_ID
The Enter_Jobsite_Name and Enter_Machine_ID are used to request jobsite name and machine ID from the user. This command creates a directory/folder by concatenating these names. This is very useful if the technician is using his/her device to test multiple machines on a jobsite.
Differentiate_Frequency_Data
Differentiates the frequency data. This performs the same function as the Differentiatebutton on the Frequency View in the app.
Disable_Triggering
This command disables all triggering. At this time triggering is not fully supported for scripting and therefore this command is recommended for all scripts.
Enter_Jobsite_Name
Displays a dialog asking the user to enter the jobsite name.
Enter_Machine_ID
Displays a dialog asking the user to enter the machine ID.
Enter_Customer_Name
Displays a dialog asking the user to enter the customer name. The name is saved and appears in the header of the PDF report (the same value shown in the Customer Name field on the Options screen).
End
Marks the end of a script. This must be the last command in the script.
Hide_Peaks (Deprecated)
DEPRECATED - The new report function introduced in Version 5.00 removes the need for this command. It is now treated as a comment and does not execute.
Instruction
Presents a dialog box with a text instruction for the user. The script execution halts until the user presses the Ok button. This command is very useful for providing instructions on how to properly connect and position the sensors.
Integrate_Frequency_Data
Integrates the freqeuncy data. This performs the same function as the Integrate button on the Frequency vew in the app.
Load_Data_From_File
Loads a Vibration data file from the filename supplied in the argument. Vibration Pro looks for the file in the folder which was selected using the Select_Default_Directory_For_Loading command. This command is primarily used for testing scripts with saved data and reprocessing data using different parameters after it has been acquired.
Load_Defaults_From_File
Loads defaults from the files specified in the argument. The file must be located in the root of the Vibration Pro directory on your device.
Load_Defaults_From_File_With_Dialog
Presents a file dialog allowing the user to locate and load a settings file from their device. If the user cancels the dialog the scruipt will terminate.
The argument is ignored.
Request_Numeric_Entry_With_Parameter
Ask the user to enter a numeric value. The argument is the name of the value you would like the user to enter. For example.
Request_Numeric_Entry_With_Parameter, Motor Power
will present a dialog box that says "Please Enter Motor Power" and a numeric entry keyboard will be displayed. The entered value will be appended to the current text buffer as
Motor Power, 50
This command is useful for recording manually entered numeric values in a text file.
Request_Text_Entry_With_Parameter
Ask the user to enter a text string. The argument is the name of the value you would like the user to enter. For example.
Request_Text_Entry_With_Parameter, Customer Name
will present a dialog box that says "Please Enter Customer Name" and a text entry keyboard will be displayed. The entered value will be appended to the current text buffer as
Customer Name, Acme Corporation
This command is useful for recording manually entered text responses in a text file.
Sample
Instructs Vibration Pro to start acquiring data.
Save
Saves the current data set to the current directory with the name specified in the argument of the Set_Data_File_Name command. This command writes both the data (CSV) file and a PDF analysis report (the Time Series and Frequency plots plus the frequency peaks for each active channel), using the same base name. If you want only the report and do not need to save the data file, use Save_Report instead.
Save_As
Saves the current data (CSV) file in the current directory with the name specified in the argument of this command. As with Save, this writes both the data file and a PDF analysis report using that name. If you want only the report and not the data file, use Save_Report_As instead.
Save_Defaults_To_File
Saves the system Default settings to the file designate in the argument. The location of the saved defaults file will be the directory which has been specified for the saving of data files. This is very useful for diagnosing setup issues.
Save_Report
Generates a PDF analysis report for the current data set and saves it to the current directory using the name specified by the Set_Data_File_Name command (the same base name used by Save). The report contains the Time Series and Frequency plots, the frequency peaks for each active channel, and a header with the acquisition details — date and time, sensor, sample rate, Fmax, windowing, frequency data state, and location (when available). Use this command when you want the report without re-saving the data file.
Save_Report_As
Sets the base file name to the string provided in the argument and then generates the PDF analysis report (see Save_Report) using that name. Only the report is written — the data (CSV) file is not saved (use Save_As if you want both). Equivalent to issuing Set_Data_File_Name followed by Save_Report.
Save_Text_File_As
Saves the current text buffer in the current directory with the name specified in the argument of this command.
Select_Default_Directory_For_Loading
Presents a dialog box to select a folder where the Load_Data_From_File command will look for files.
Select_BT_Sensor
Selects a bluetooth sensor. At the present time the only BT sensors which are supported are the CTC WS200 (single axis) and the CTC WS300 (3 axis). There may be more than one bluetooth sensor within range of the device therefore it is necessary to specify the serial number of the sensor you desire to use in the as the argument. You do not need to specify the type of sensor, only the serial number. The app will determine the sensor type based on the serial number.
Select_High_Speed_Sensor
Selects one of the high speed sensors such as the microhone, one of the Modal Shop USB sensors or the Sabrent USB-C microphone input. The desired sensor is selected from the argument drop down list.
Select_Internal_Sensor
Select one of the internal sensors such as the internal Gyroscope or Accelerometer. The desired sensor is selected from the argument drop down list.
Set_485B39_Ch1_Calibration_Value and Set_485B39_Ch2_Calibration_Value
Many of the sensors used with Vibration Pro load their specific calibraiton values when the sensor is connected to the iPhone/iPad. The 485B39 has two BNC type connectors and is unable to read the calibration values of sensors connected to the interface. These commands allow those values to be entered. When using accelerometers the values are entered in Volts/g. If other types of sensors are used the values should be entered in Volts/unit. Then when reading the plots the units of "g" should be interpreted as the units of the sensor.
Set_Acquisition_Length
Sets the length of the acquisition. The desired length is selected from the argument drop down list.
Set_Auto_Repeat_Delay
Sets the delay between auto-repeated acquisitions. Since Auto Repeat is not recommended for scripts this command is not normally necessary but for completeness during setup it is recommended that this command be used during the setup phase of the script and that that argument be set to 0.0
Set_Auto_Repeat_ON
Turns on or off the Auto Repeat function allowing the acquisition to automatically repeat until the user touches the Cancel "X" button. Turning this on during scripting is problematic because at this time there is no way to camcel the acquisition while under scripting control.
Set_Auto_Save_ON
Turns on or off the Auto Save functionality. While this can be used during scripting it is recommended that the script commands Save or Save_as be used instead and that Set_Auto_Save_ON, OFF be used.
Set_Coordinate_System_Handedness
Sets the coordinate system handedness. This is only necessary for the internal accelerometer. The handedness is selected from the argument drop down list.
Set_Data_File_Name
Sets the file name to the string provided in the argument. This name will be used the next time the Save command is issued.
Set_Default_Email_Address
Sets the default email address to the value provided in the argument. This is the same as setting the default email address in the Options Settings page.
Set_Disconnect_Bluetooth_When_In_Background_ON
Allows the script to enable or disable whether Vibration Pro disconnects from Bluetooth devices when the app is in the background. Set to YES if you want the app to forget all BT devices when the app is not active. Set to NO if you want to maintain connections (best choice for scripting)
Set_Frequency_Alarm_Limit
Sets the level of the frequency Alarm Limit. The argument expects a decimal number which is the value of the limit. When this value is exceeded in the frequency data, the plot lines will turn a bright yellow. To disable limits set this value to 0.0.
Set_Frequency_Display_Ch1_ON
Turns on or off the display of Channel 1 in the log-log frequency display. The desired state is selected in the argument drop down menu.
Set_Frequency_Display_Ch2_ON
Turns on or off the display of Channel 2 in the log-log frequency display. The desired state is selected in the argument drop down menu.
Set_Frequency_Display_Ch3_ON
Turns on or off the display of Channel 3 in the log-log frequency display. The desired state is selected in the argument drop down menu.
Set_Frequency_Display_Frequency_Units
Sets the frequency display units to Hz or RPM. The desired selection is chosen in the argument drop down menu.
Set_Frequency_Display_LogPlot_Horizontal_ON
Turns on or off log plotting on the horizontal axis of the frequency display. The desired state is selected in the argument drop down menu.
Set_Frequency_Display_LogPlot_Vertical_ON
Turns on or off log plotting on the vertical axis of the frequency display. The desired state is selected in the argument drop down menu.
Set_Frequency_Display_Peak_Hold_ON
Turns on or off the peak hold function of the frequency display. The desired state is selected in the argument drop down menu.
Set_Frequency_Display_Running_Average_ON
Turns on or off the running average function of the frequency display. The desired state is selected in the argument drop down menu.
Set_Frequency_Display_Windowing
Sets the type of windowing to either OFF, HAMMING, HANNING or FLATTOP. The desired state is selected in the argument drop down menu.
Set_High_Speed_Sensor_Fmax_kHz
Sets the maximum frequency of the selected high speed sensor. The frequency must be selected from the drop down list. Other values are illegal.
Set_Internal_Sensor_Fmax_Hz
Sets the maximum frequency of the selected internal sensor. The frequency must be selected from the drop down list. Other values are illegal.
Set_Master_Directory_To_CY_ON
Set_Master_Directory_To_CY_ON ON Sets the "Master Directory" to the current calendar year. Placing this command at the start of the file causes all subsequent Create_Directory commands to create their directories in a master directory named by the current calendar year.
Set_Master_Directory_To_CY_ON OFF causes all subsequent Create_Directory commands to be located directly in the VibrationPro directory on the i-Device
Set_Peak_Search_Lower_Limit
Sets the lower frequency limit used for the Peak Search function to the value of the argument which should be an integer or decimal number. The default is 5 Hz and it can be set from 0 to 1/2 of Fmax. If the value is set to greater than 1/2 of Fmax it will automatically be limited to 1/2 Fmax.
This function is useful to avoid finding peaks close to 0 frequency which may be unimportant.
Set_Sample_Delay
Sets the delay between when the Sample command is given and when the sample actually starts. The argument is the number of seconds for the delay and is a freeform entry.
This command can be used to delay the start of a sample, for example if the operator needs to perform some action before the start of acquisition.
Set_Script_Window_Visibility
Sets the visibility of the script window. If you want the user to be able to watch the data acquisition set the visibility to OFF. This will hide the script window until you turn it back ON or the script terminates. If you turn visibility OFF all prompts will still appear. It is not necessary to turn the visibility back on at the end of the script. The End command will automatically turn the window back on. Also any errors will result in the window visibility being turned on.
Set_Time_Series_Auto_Scale_ON
Allows turning on or off the auto scaling for the vertical axis of the time series. The desired state is selected in the argument drop down menu.
Set_Time_Series_Display_Ch1_ON
Turns on or off the display of Channel 1 in the time series display. The desired state is selected in the argument drop down menu.
Set_Time_Series_Display_Ch2_ON
Turns on or off the display of Channel 2 in the time series display. The desired state is selected in the argument drop down menu.
Set_Time_Series_Display_Ch3_ON
Turns on or off the display of Channel 3 in the time series display. The desired state is selected in the argument drop down menu.
Set_Time_Series_Plot_All_Points_ON
Turns on or off the plot all points feature of the time series display. The desired state is selected in the argument drop down menu.
Set_Time_Series_Subtract_Mean_ON
Turns on or off the subtract mean function of the time series display. The desired state is selected in the argument drop down menu.
Set_Time_Series_Vertical_Scale
Sets the vertical scale of the time series to a specific value. The scale must be selected from the drop down list. Other values are illegal.
Set_Time_Series_Vertical_Scale_Multiplier
Sets the vertical scale multiplier for the time series. The multiplier must be selected from the drop down list. Other values are illegal.
Set_Timer_Sounds_ON
Turns on or off the sound effects for the timer and data acquisition. The desired state is selected in the argument drop down menu.
Set_Units
Sets the units to Metric/Radians, English/Degrees or Mils/Degrees. The desired state is selected in the argument drop down menu.
Set_WS200_Max_G_Force
The WS200 sensors have 4 different g force ranges 8g, 16g, 32g and 64g. This command allows the script to set the range to the desired value.
NOTE: At this time Set_WS200_Max_G_Force and Set_WS300_Max_G_Force do the same thing and control the max G force for both sensors. They cannot be controlled individually.
Set_WS300_Max_G_Force
The WS300 sensors have 4 different g force ranges 8g, 16g, 32g and 64g. This command allows the script to set the range to the desired value.
NOTE: At this time Set_WS200_Max_G_Force and Set_WS300_Max_G_Force do the same thing and control the max G force for both sensors. They cannot be controlled individually.
Set_WS_Sensor_Fmax
Sets the Fmax value for the WS200/WS300 sensor from the drop down list in the argument column. This command should be executed before executing the Set_WS_Sensor_Acquisition_Length command. This is necessary because the acquisition length is dependent on the Fmax value.
Set_WS_Sensor_Acquisition_Length
Sets the data acquisition length for the WS200/WS300 sensor from the drop down list in the argument column. This command should be executed after executing the Select_BT_Sensor and Set_WS_Sensor_Fmax commands. This is necessary because the acquisition length is dependent on the sensor type and Fmax value. Note that the drop down is not intelligent enough to modify itself based on the sensor and Fmax so you should familiarize yourself with the allowable values for each sensor and value of Fmax as shown in the table below. If you mistakenly select a value which is out of range VibrationPro will automatically select the closest allowable value.
CTC WS200 Allowable Fmax/Acquisition length combinations
| Frequency | Allowable data Acquisition Lengths |
|---|---|
| 156.25 | 1024, 2048 |
| 312.5 | 1024, 2048, 4096 |
| 625 | 1024, 2048, 4096, 8192 |
| 1250 | 1024, 2048, 4096, 8192, 16384 |
| 2500 | 1024, 2048, 4096, 8192, 16384 |
| 5000 | 2048, 4096, 8192, 16384 |
| 10000 | 4096, 8192, 16384, 32768 |
CTC WS300 Allowable Fmax/Acquisition length combinations
| Frequency | Allowable data Acquisition Lengths |
|---|---|
| 156.25 | 1024, 2048 |
| 312.5 | 1024, 2048, 4096 |
| 625 | 1024, 2048, 4096, 8192 |
| 1250 | 1024, 2048, 4096, 8192, 16384 |
| 2500 | 1024, 2048, 4096, 8192, 16384 |
| 5000 | 2048, 4096, 8192, 16384 |
| 10000 | 4096, 8192, 16384 |
Show_Peaks_At_Location
DEPRECATED - The new report function introduced in Version 5.00 removes the need for this command. It is now treated as a comment and does not execute.
Subscriptions for Running Scripts
Running scripts requires a monthly subscription. To enable the ability to run scripts touch the Script button. This will open the script view. The right button for running scripts will be greyed out and there will be a Subscribe button below it. Touch the Subscribe button and the In App Purchase screen will open. If you have a network connection the in-app purchase option for the subscription will appear. Select the subscription duration you wish to purchase and confirm your purchase.
Your subscription will automatically renew on the renewal date so you will not lose the ability to run scripts. If you do not need to run scripts for a period of time you can cancel the subscription at any time. To cancel the subscription simply navigate to the iDevice Settings App, touch your Apple ID at the top of the app, then touch Media and Purchases, touch View Account and then scroll and touch Subscriptions. This page will show your subscriptions. Select the Vibration Pro scripting subscription and touch Cancel. You can cancel at any time. When you cancel the subscription will remain active until the end of the current subscription.
You are allowed to subscribe and cancel as often as you like.
Troubleshooting
A Bluetooth sensor stops responding, or reports a fault (Vibration Pro only)
If a CTC WS200 or WS300 sensor stops sending data, or the app reports that the sensor has a fault, remove the sensor's battery, wait a moment, and refit it.
Some sensor faults are cleared only by a power cycle. They are not cleared by moving out of range and back, by quitting and reopening the app, or by selecting a different sensor and returning. If the sensor still will not take data after an app restart, a battery pull is almost always the remedy.
The Acquire button is greyed out during a Bluetooth measurement (Vibration Pro only)
This is intentional. Once a CTC WS200 or WS300 sensor has begun a reading it must be allowed to finish sending its data. The sensor has no way to abandon a reading part way through, and interrupting one leaves it holding data that was never collected — which corrupts the measurement and puts the sensor into a fault state.
The Acquire button therefore becomes unavailable from the moment the sensor is told to take data until the last of that data has arrived. It re-enables by itself. If Auto Repeat is on, Cancel stays available throughout and stops the repeating sequence after the current measurement completes.
“Incomplete Data” warning after a measurement (Vibration Pro only)
Vibration Pro checks that every packet of data sent by a Bluetooth sensor actually arrived. If any are missing, it tells you rather than displaying a measurement that looks complete but is not — a channel with missing data reads as zero, which can easily be mistaken for a quiet axis.
The data shown should not be used. Take the measurement again. If this happens repeatedly, move the iPhone or iPad closer to the sensor; radio interference and distance are the usual causes.
Version History
Version 5.01
- A new, more robust Bluetooth connection handler that reconnects more reliably and provides clearer device status when using multiple Bluetooth sensors across different locations (Vibration Pro only)
- Fixed a scripting bug where extended (special) characters could prevent a script file from being saved in the output directory (Vibration Pro only)
- Improved timebase calibration of CTC WS series of sensors. Measurements now use the sample rate the sensor reports for itself rather than the nominal rate, so reported frequencies may differ from those in earlier releases — typically by 2% to 4%, depending on the individual sensor. The new values are the correct ones (Vibration Pro only)
- Corrected the maximum frequency (Fmax) shown in the PDF report for CTC WS sensors, which was previously too high (Vibration Pro only)
- Vibration Pro now checks that every packet of measurement data sent by a Bluetooth sensor actually arrived, and warns you if any are missing instead of showing an incomplete measurement as though it were complete (Vibration Pro only)
- Faults reported by a Bluetooth sensor are now shown to you, with the remedy, rather than being ignored. A measurement that stops part way through is now ended with an explanation instead of waiting indefinitely (Vibration Pro only)
- A Bluetooth measurement can no longer be cancelled once the sensor has begun taking data, because interrupting one corrupts the measurement and puts the sensor into a fault state. See Troubleshooting (Vibration Pro only)
- Bug fixes
Version 5.00
Version 5.00 is a major redesign of Vibration and Vibration Pro, with an all-new modern interface and a number of new features. Features marked (Vibration Pro only) are available only in Vibration Pro; features marked (Vibration only) are available only in Vibration. Highlights include:
- A completely redesigned interface with consistent, color-coded X, Y, and Z channels and card-based layouts
- Redesigned Time Series view — each channel in its own card, with a sensor and data-file info bar and a stats bar showing vertical scale, horizontal scale, duration, and sample rate
- Redesigned Frequency Analysis view — floating Integrate, Differentiate, and Peaks buttons, plus a color-coded peaks list
- A tap-and-drag cursor readout on both plots to read exact values at any point, in portrait or landscape
- Improved landscape mode with full-screen plots and an auto-hiding toolbar (swipe down from the top edge to reveal it)
- Redesigned settings screens for Data Source, Acquisition, Triggering, Time Display, Frequency Display, and Options
- A new PDF report that is crisp and identical on iPhone and iPad, including both plots, the sensor name, and the data file name
- Guided accelerometer calibration with an on-screen orientation guide, a live stability meter, a reposition countdown, and audible cues (Vibration only)
- A redesigned Machine Menu (Vibration Pro only)
- A redesigned Scripting screen with a command list and Run and Load buttons (Vibration Pro only)
- New
Save_ReportandSave_Report_Asscript commands (Vibration Pro only) - A refreshed tab bar and icons, a new splash screen, a redesigned Help screen, and numerous bug fixes and stability improvements
VERSION 4.20 - June 2026
- Added command Set_Master_Directory_To_CY_ON so that the user can put all files for a calendar year in a folder for that year. (Vibration Pro Only)
- Appended the date and time to directories create using Create_Directory_From_Jobsite_Machine_ID. (Vibration Pro Only)
VERSION 4.19 - May 2026
- Fixed a bug where rms values were not display propelry in the Peaks window after integration
- Modified the frequency rms computation to exclude more data near 0 frequency since this was biasing the results, particularly after integration of the frequency dat
VERSION 4.18 - January 2026
- Fixed a bug where Peak Hold and Running Averages did not work in all input modes.
- Added driver for Sabrent input/output dongle
- Added scripting command for Sabrent Dongle (Vibration Pro Only)
VERSION 4.17 - Sept 2025
- Added interface for CTC WS300 wireless Bluetooth 3 axis sensor (Vibration Pro Only)
- Added scripting commands for WS300 (Vibration Pro Only)
- Bug and usability fixes
VERSION 4.16 - July 2025
- Added ability to select maximum g-force for WS200 sensor - Vibration Pro only
- Added switch to allow Vibration Pro NOT to disconnect from Bluetooth devices when in background - Vibration Pro only
- New Script Command: Set_Disconnect_Bluetooth_When_In_Background_ON:ON/OFF - Vibration Pro only
- New Script Command: Set_WS200_Max_G_Force:8/16/32/64 - Vibration Pro only
- New Script Command: Add_Version_To_Text_File - Vibration Pro only
VERSION 4.15 - May 2025
- Fixed a bug which caused Digiducer family of devices to occassionally fail to connect during scripts
VERSION 4.14 - April 2025
- Improved sensing of bluetooth devices - Vibration Pro only
VERSION 4.13 - March 2025
- Added support for CTC WS200 Bluetooth wireless single axis accelerometer - Vibration Pro only
- Added scripting commands for CTC WS200 - Vibration Pro only
- Updated Apple Watch interface to support CTC WS200 in Apple Watch companion app - Vibration Pro only
- Fixed bugs in Apple Watch companion app interface
- Added annual scripting subscription option - Vibration Pro only
- Changed Peak Snap Tolerance.
VERSION 4.12 - May 2024
- Fixed a bug where sometimes script files would not load and app would crash.
VERSION 4.11 - October 2023
- Modified the anti-aliasing filter for F-Max values less than 4kHz to provide better alias rejection. This change applies to Microphone input and external accelerometer input only.>
- Added Set_Script_Window_Visibility command. This command hides the script window making it possible for the user to watch the data acquisition. - Vibration Pro only
- Added ability to turn on and off time series display channels.
VERSION 4.10 - March 2023
- Bug Fixes
- Fixed bug where peaks data did not populate window when running scripts on iphone - Vibration Pro only
VERSION 4.09 - October 2022
- Added jobsite name and machine ID to plots when available.- Vibration Pro Only
- Fixed formatting error when script is saved to job directory. When script was read using the Load Script button nothing was displayed and script would not run.- Vibration Pro Only
VERSION 4.08 - August 2022
- Fixed a bug where the peak locations and amplitudes did not display in saved data from a script when run on iPhone. - Vibration Pro Only
- Fixed a bug where the time series screen print from a script did not fill the image. - Vibration Pro Only
VERSION 4.07 - August 2022
- Fixed bug where machine menu scripts would not always load. - Vibration Pro Only
VERSION 4.06 - July 2022
- Disabled close button in script window while script is executing. - Vibration Pro only
- Added Machine Menu option. - Vibration Pro only
- When script window is re-opened the previous script will be reloaded if it is still available. - Vibration Pro only
- Updated the Excel Script Builder file to include a template for building Machine Menus. - Vibration Pro only
- Added the script commands Select_Default_Directory_For_Loading and Load_Data_From_File. - Vibration Pro Only
- Adding an ! at the start of a script command will turn it into a comment. This is useful for temporarily disabling a command. - Vibration Pro Only
- Updated some icons.
VERSION 4.05 - February 2022
- The Frequency Alarm can now be disabled by either clearing the field or setting it to zero. - Vibration Pro only
- Fixed bug where script would not scroll during execution in some cases.
VERSION 4.04 - February 2022
- Updated the Peak Search Limit and the Alarm Limit text edit boxes to clear upon the start of editing per customer request - Vibration Pro only
- Updated the peak display to only show the data from the traces which are active on the frequency display
- Added Hanning and Flattop windows for frequency processing
- Enhanced script command Set_Frequency_Display_Windowing to handle Hanning and Flattop windows - Vibration Pro only
- Added support for the new 333D04 USB accelerometer from Digiducer
VERSION 4.03 - January 2022 - Vibration and Vibration Pro
- Improved layout of peaks display on iPad and iPhone
- Improved some UI layout issues
- Frequency cursor "Snap to peak" now respects Channel ON/OFF switches in Frequency Display Settings
- Channel ON/OFF switches in Frequency Display Settings no work for linear-linear frequency plots
- Added frequency alarms. When values in the frequency plots exceed the preset limit they turn bright yellow. - Vibration Pro Only
- Added two new scripting commands: Set_Frequency_Alarm_Limit and Clear_Frequency_Alarm_Limit. - Vibration Pro Only
- Added the Frequency Alarm Limit value to Save and Load Settings. - Vibration Pro only
- Fixed bug where Fmax and horizontal scale labels would overlap each other when in X-Linear, Y-Log mode in frequency plot.
VERSION 4.02 - December 2021 - Vibration and Vibration Pro
- Added the following new command to the scripting language: - Vibration Pro only
Load_Defaults_From_File_With_Dialog
Set_Peak_Search_Lower_Limit - Added the rms display computation of the frequency data to the iPhone.
- Improved the peaks display window on the iPhone so that scrolling will work properly
- Users can now limit the low frequency limit for the frequency peak function using Peak Search Limit in the Frequency Display Settings screen.
VERSION 4.01 - November 2021 - Vibration Pro
- Migrated to iOS 15 libraries - All
- Added the following new commands to the scripting language - Vibraiton Pro Only
Set_Auto_Repeat_ON Set_Auto_Save_ON
Set_Sample_Delay
Disable_Triggering Save_Defaults_To_File
Load_Defaults_From_File
Set_Auto_Repeat_Delay Set_485B39_Ch1_Calibration_Value Set_485B39_Ch2_Calibration_Value - Added ability to save and load settings files - Vibration Pro Only
VERSION 4.00 - August 2021 - Vibration Pro and Vibration release
- Fixed bug which caused the app to crash when saving data using the save icon
VERSION 3.99 - July 2021 - Vibration and Vibration Pro
- All changes in 3.98 now included in Vibration Pro
- Added Mils/Degrees as a unit. This was requested by the HVAC industry in the US.
- Added Mils/Degrees as a unit for the Set_Units scripting command (Vibration Pro only)
- Added a Scripts subfolder to the app directory as a place where users can store scripts. (Vibration Pro only)
- Updated the Vibration Pro Script Builder.xlsm file to include the new Mils/Degrees unit selector command. ALERT!!: Make sure you update your local copy with this new version of Vibration Pro Script Builder.xlsm. (Vibration Pro only)
VERSION 3.98 - July 2021 - Vibration only
- All changes in 3.97
- Fixed bug where Peak list on iPad would move off screen in Log-log frequency mode.
VERSION 3.97 - April 2021 - Vibration Pro only
- Added option to zoom frequency view in horizontal direction only
- Fixed a bug where it might not be possible to zoom back to 1x in frequency view
- Added magnetic peaks in HUD cursor in frequency view.
- Fixed bug where Peak list on iPad would move off screen in Log-log frequency mode.
VERSION 3.96 - February 2021
Vibration only
- Fixed zoom on iPhone 12 Pro
- Added Fmax to bottom of frequency screen.
- Replace words with icons in Time Series toolbar
- Updated this manual
- Added the file names to the top of the screen when a file is saved or loaded
- Fixed a linear frequency amplitude bug
- Added computation of rms amplitude in frequency data. This is displayed on the Peaks List view (iPad only)
- Added ability to move the peaks list by dragging with your finger. (iPad only)
- Fixed bug which resulted in a blank location field in data files
VERSION 3.95 - February 2021
Vibration Pro only
- Fixed bug where file names did not print on images saved during scripting.
- Added Fmax to bottom of frequency screen.
VERSION 3.94 - February 2021
Vibration Pro only
- Release in-app purchase subscription
VERSION 3.92 - February 2021
Vibration Pro only
- First Release of Vibration Pro
- After the first run open the Files app on your device and navigate to "On My iPhone/iPad -> VibrationPro" and copy the file "VibrationPro Script Builder.xlsm" to a cloud location where you can access it from your PC/Mac. You will use this file to create automated scripts for Vibration Pro
- Running scripts requires a monthly subscription which is acquired via an in-app purchase. The subscription can be purchased or cancelled at any time.
- Vibration Pro can access a variety of external USB data acquisition modules from The Modal Shop at no additional charge. Compatable devices are listed in the manual found in the About tab.
Privacy Policy
Diffraction Limited Design, the owner of Vibration Pro, takes user privacy very seriously. Vibration Pro does not collect any data from users. All data that is saved by the app is saved locally to the app workspace on the device or in the future to your iCloud account. If you decide to allow Apple to collect crash data and send it to the developer we will receive log files and crash dumps. These files will not contain any of your personal information.
Credits
App Store receipt Validation
validatereceipt.mCreated by Ruotger Skupin on 23.10.10.
Copyright 2010-2011 Matthew Stevens, Ruotger Skupin, Apple, Dave Carlton, Fraser Hess, anlumo, David Keegan, Alessandro Segala. All rights reserved.
Modified for iOS, converted to ARC, and added additional fields by Rick Maddy 2013-08-20
Copyright 2013 Rick Maddy. All rights reserved.